The header
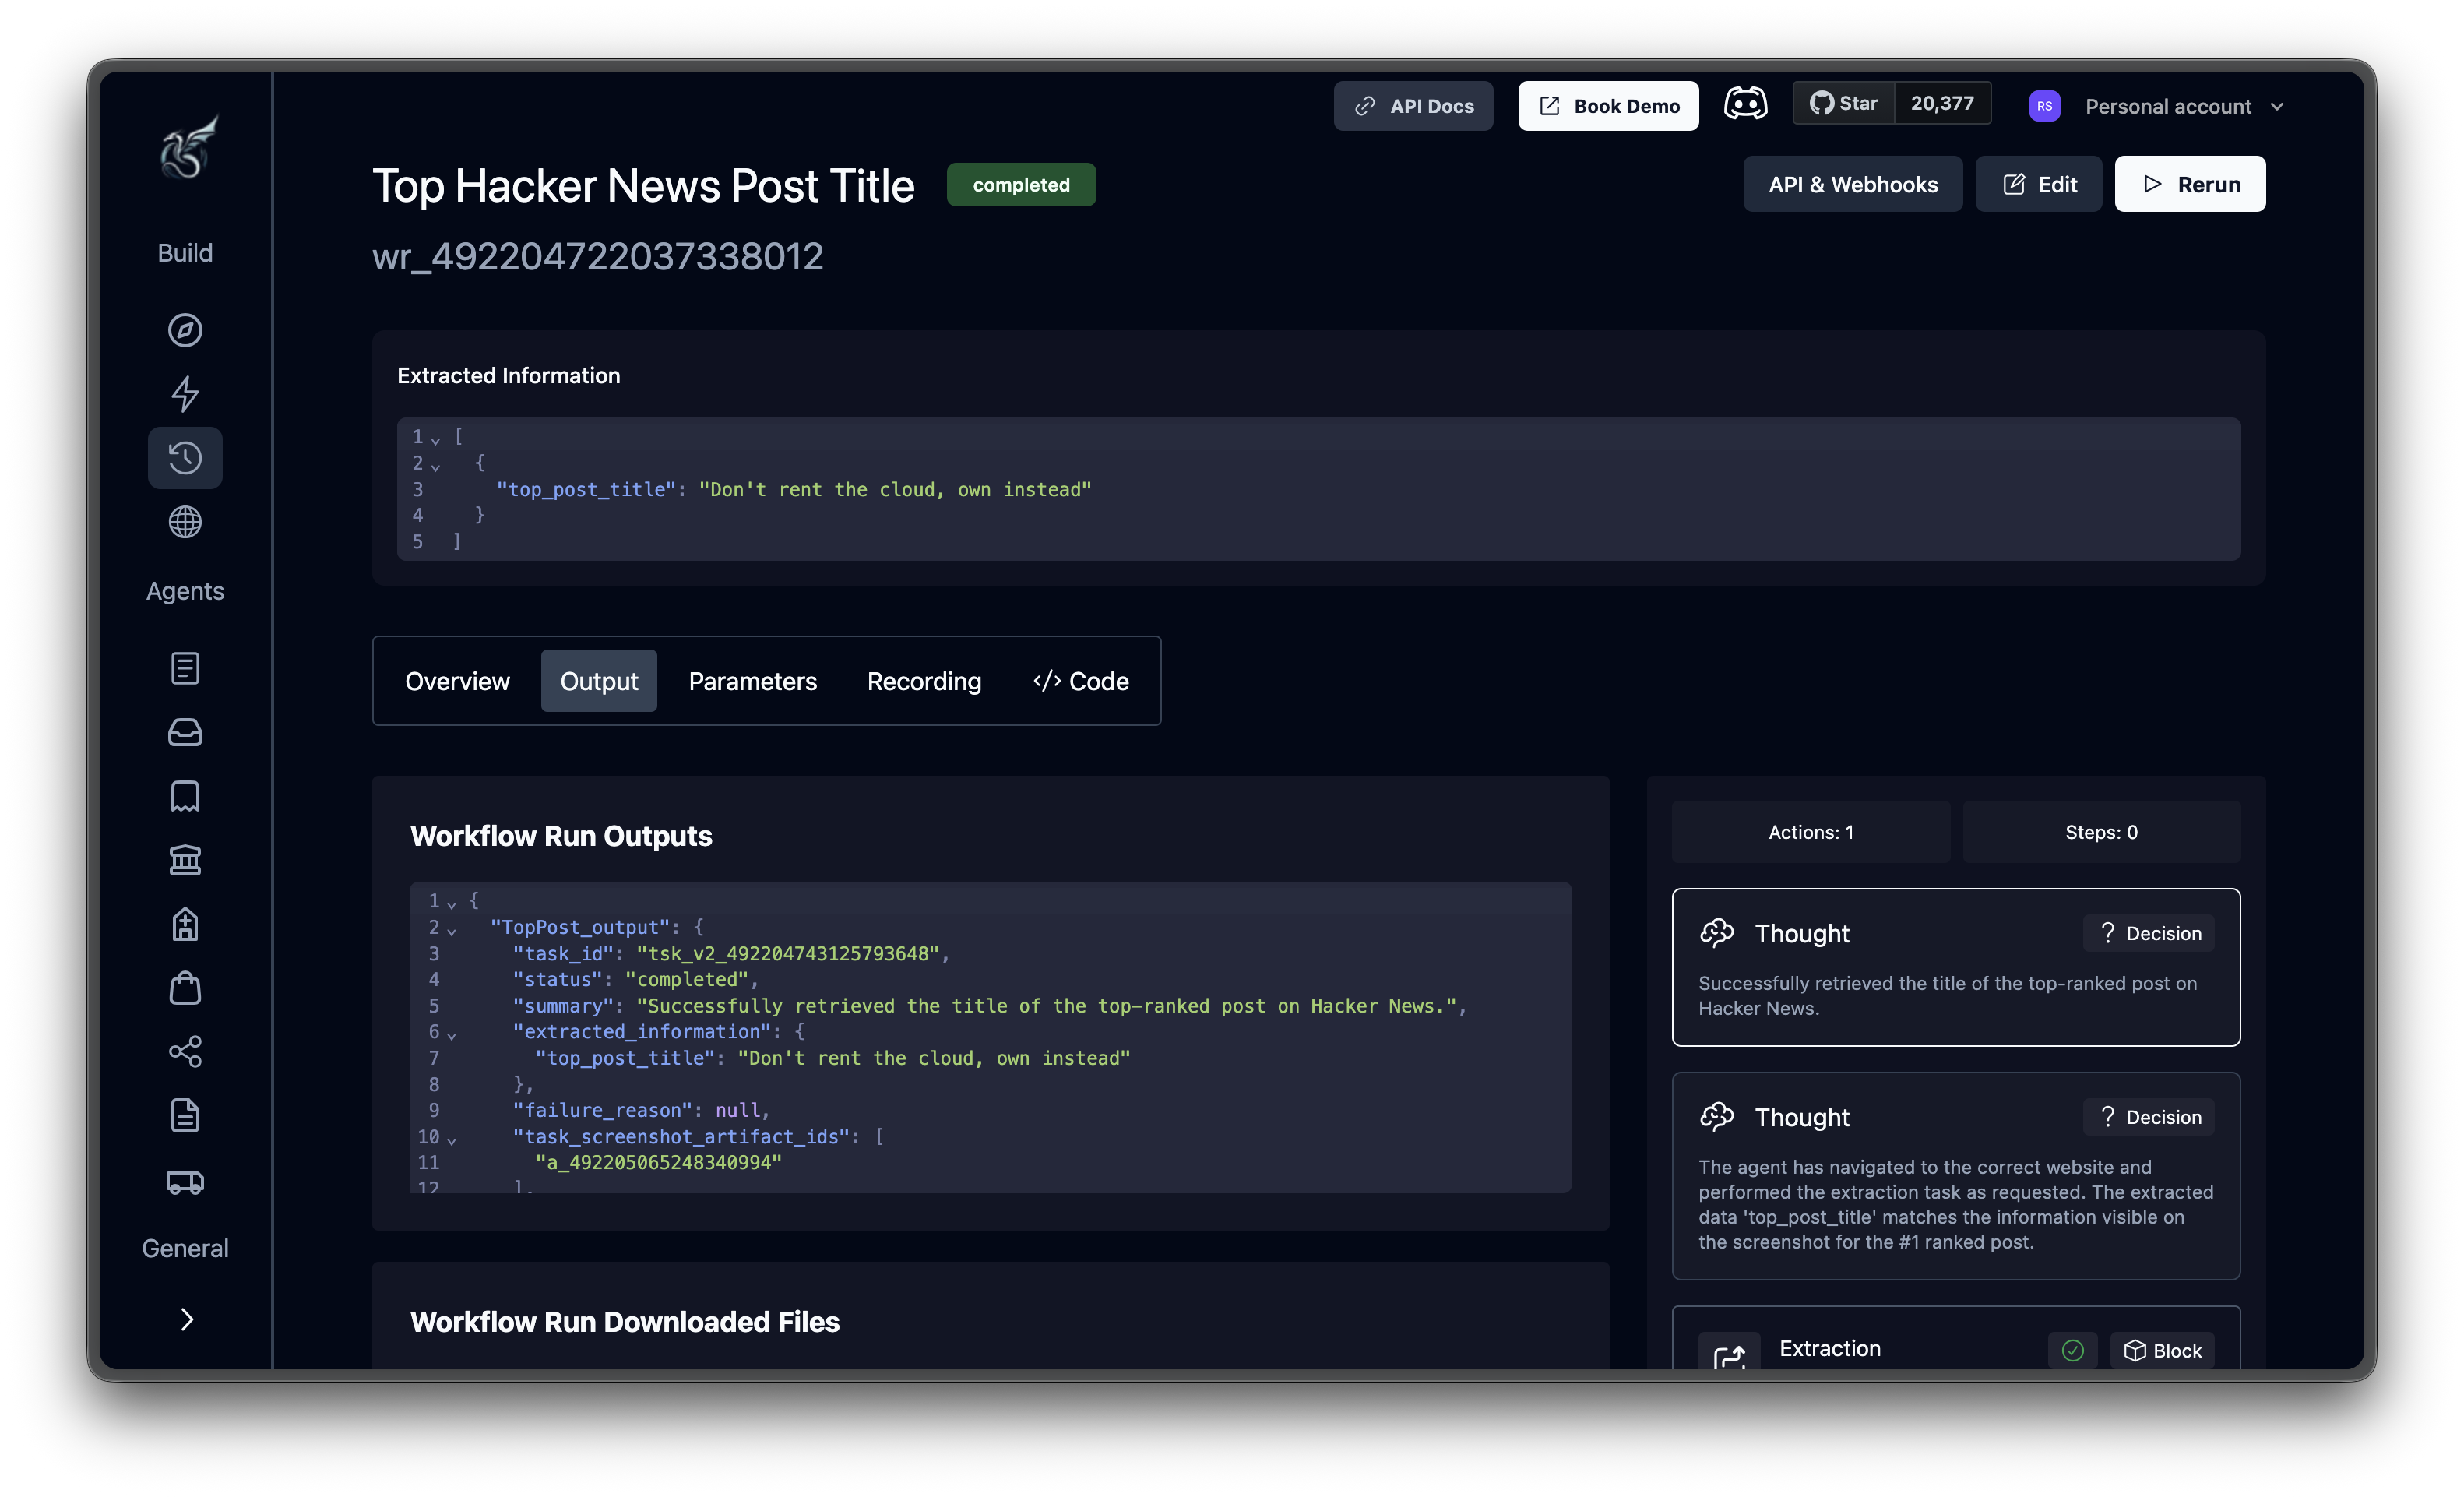
The top of the page shows the workflow title, a color-coded status badge, and the run ID. Three buttons on the right:- API & Webhooks — the exact API request that would reproduce this run, including endpoint, headers, and payload
- Edit — jump to the workflow editor
- Rerun — start a new run pre-filled with the same parameters (appears after the run finishes)
Extracted information
On success, the Extracted Information section appears above the tabs — the structured data you asked for, displayed as JSON.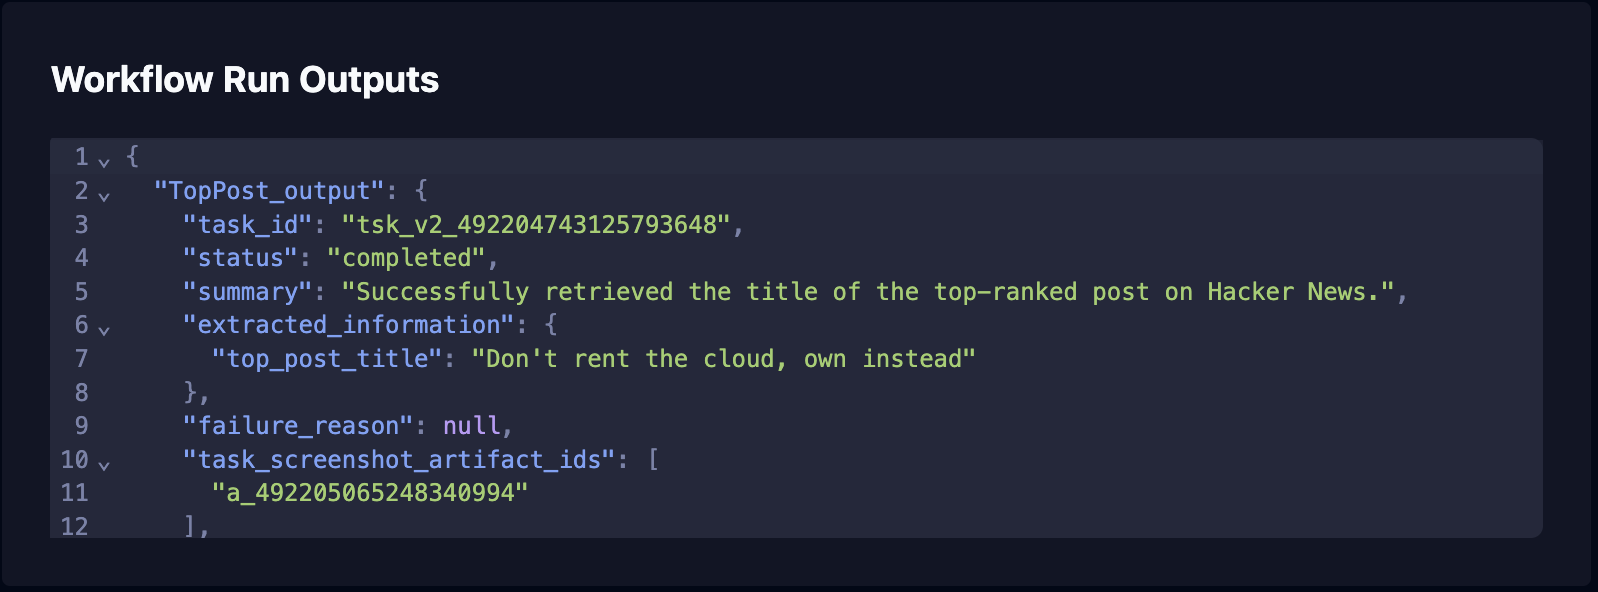
summary (natural language description of what was accomplished), extracted_information (structured data matching your schema), and a failure_reason field that’s null on success. On failure, a Failure Reason section appears instead with error details in a red box.
The five tabs
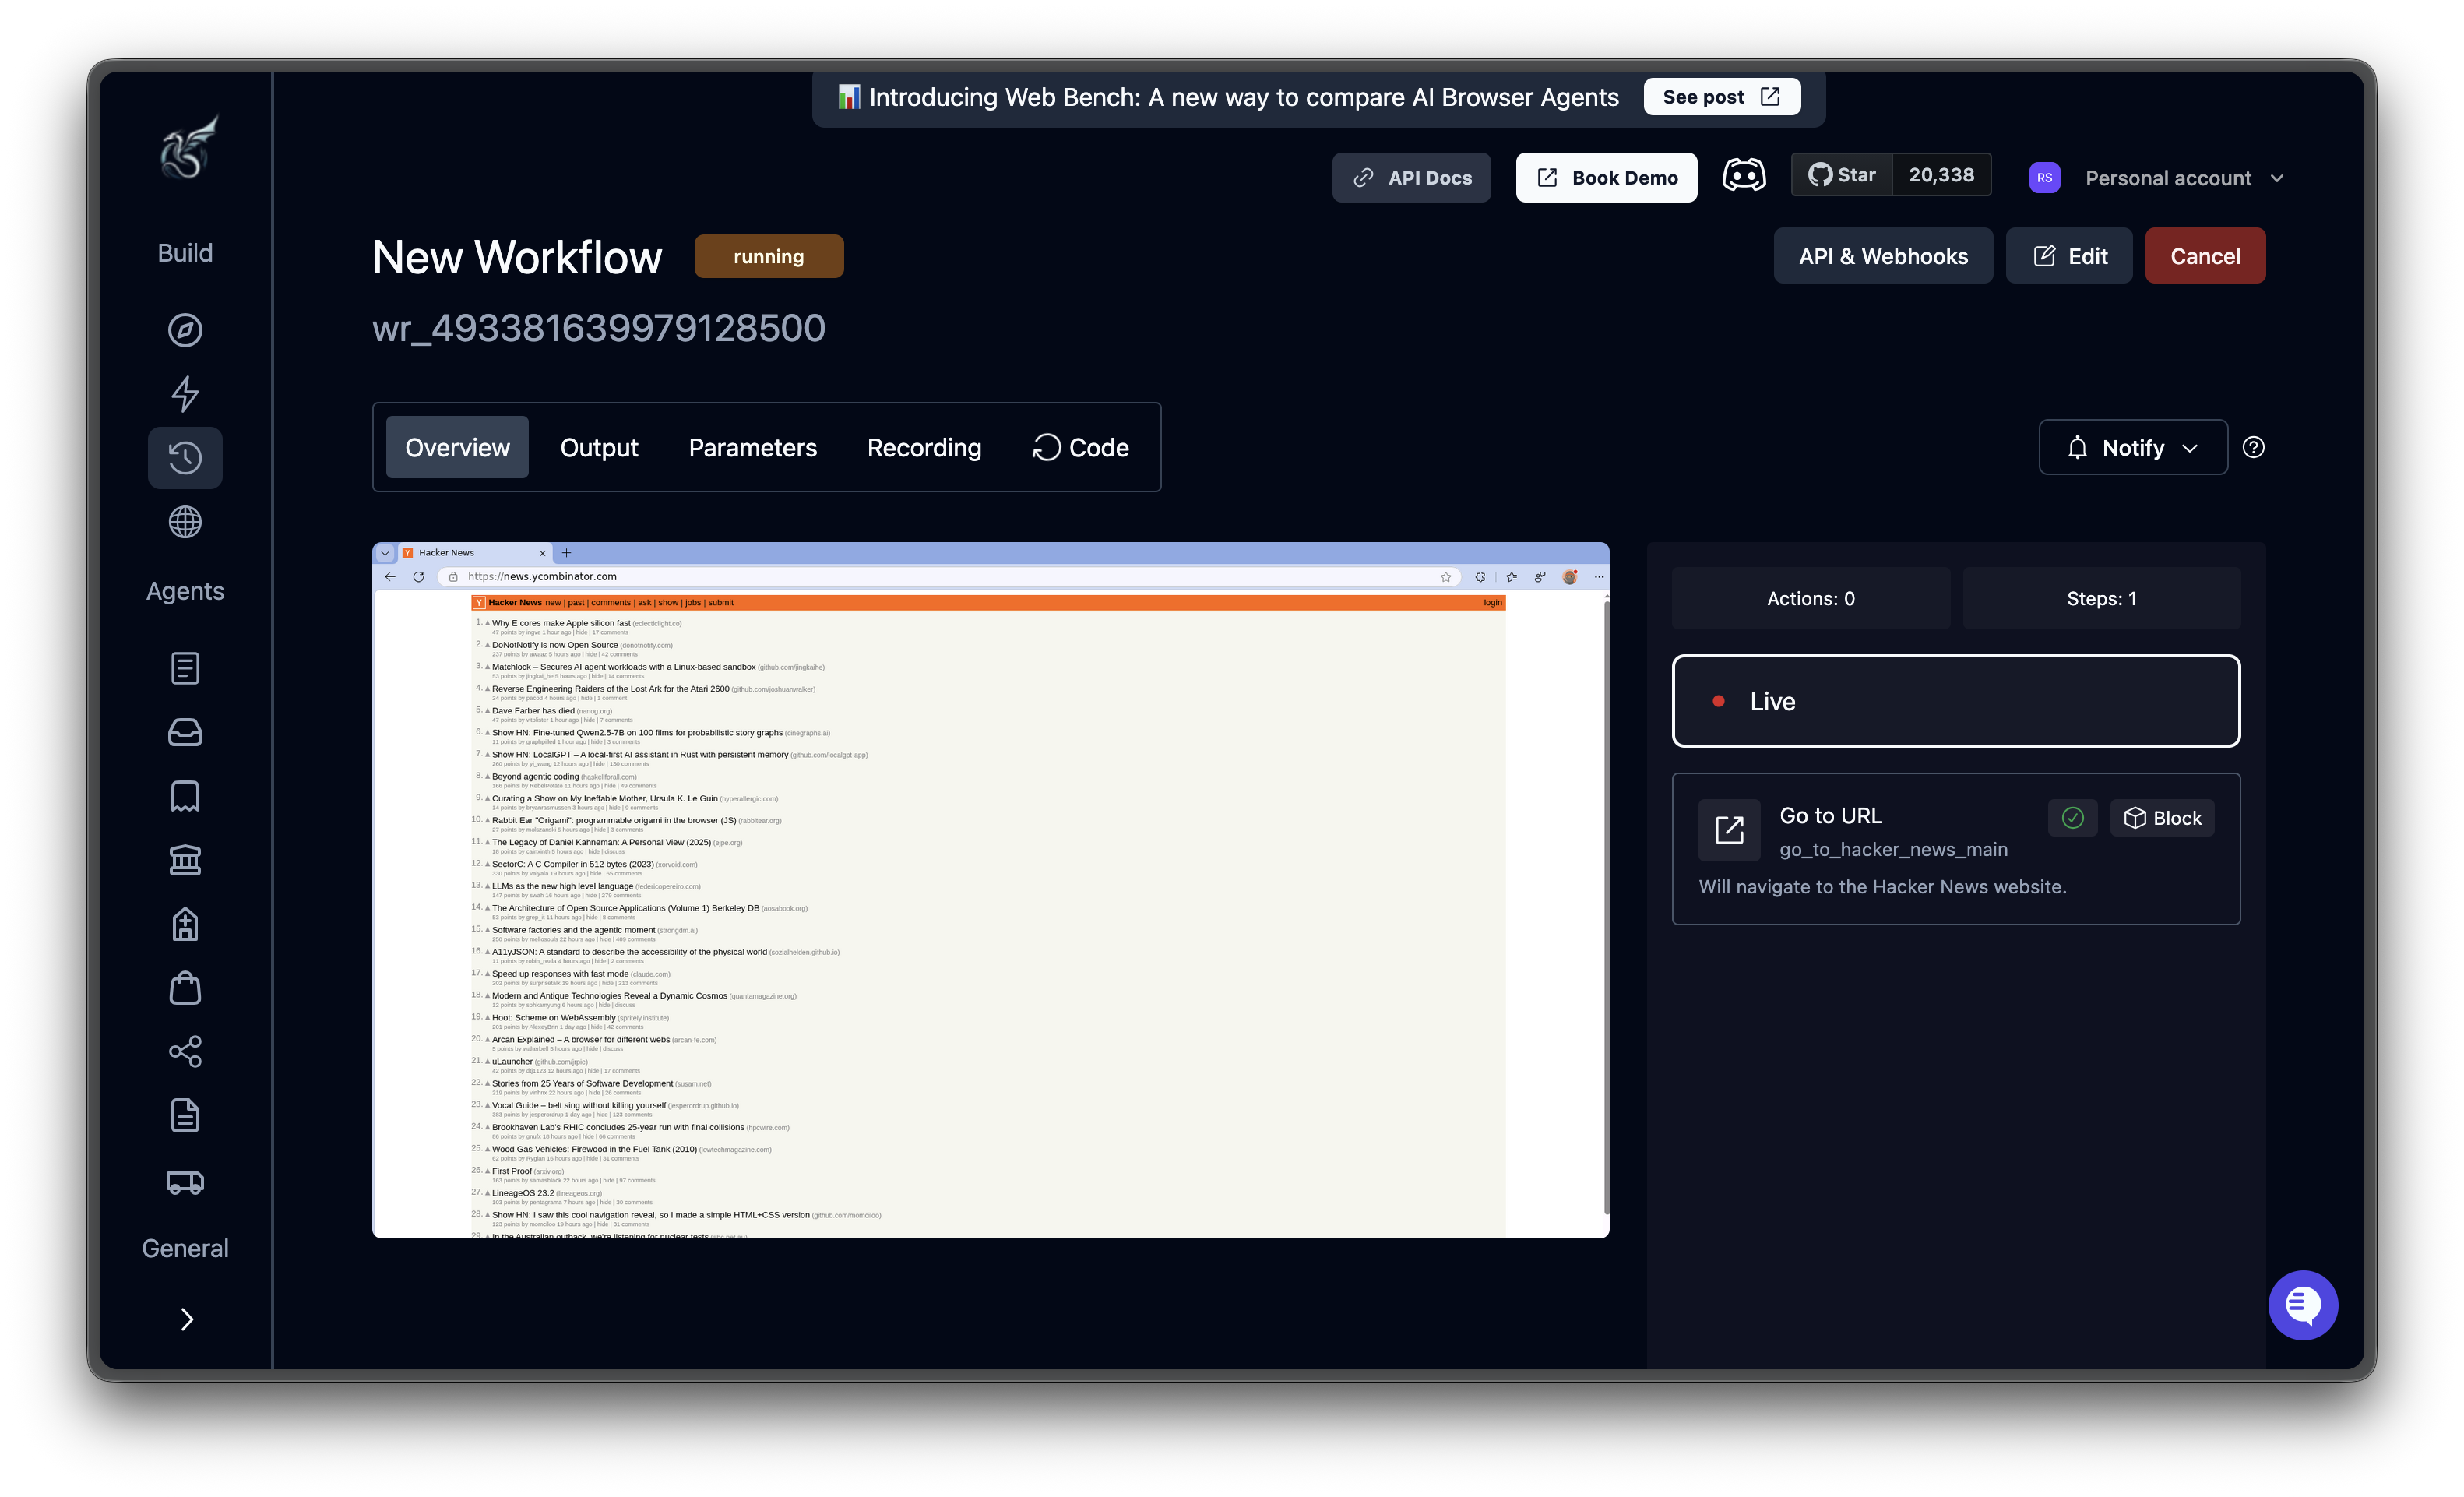
Overview
The left panel shows the browser state (live stream while running, screenshots after completion). The right panel shows the AI’s reasoning timeline.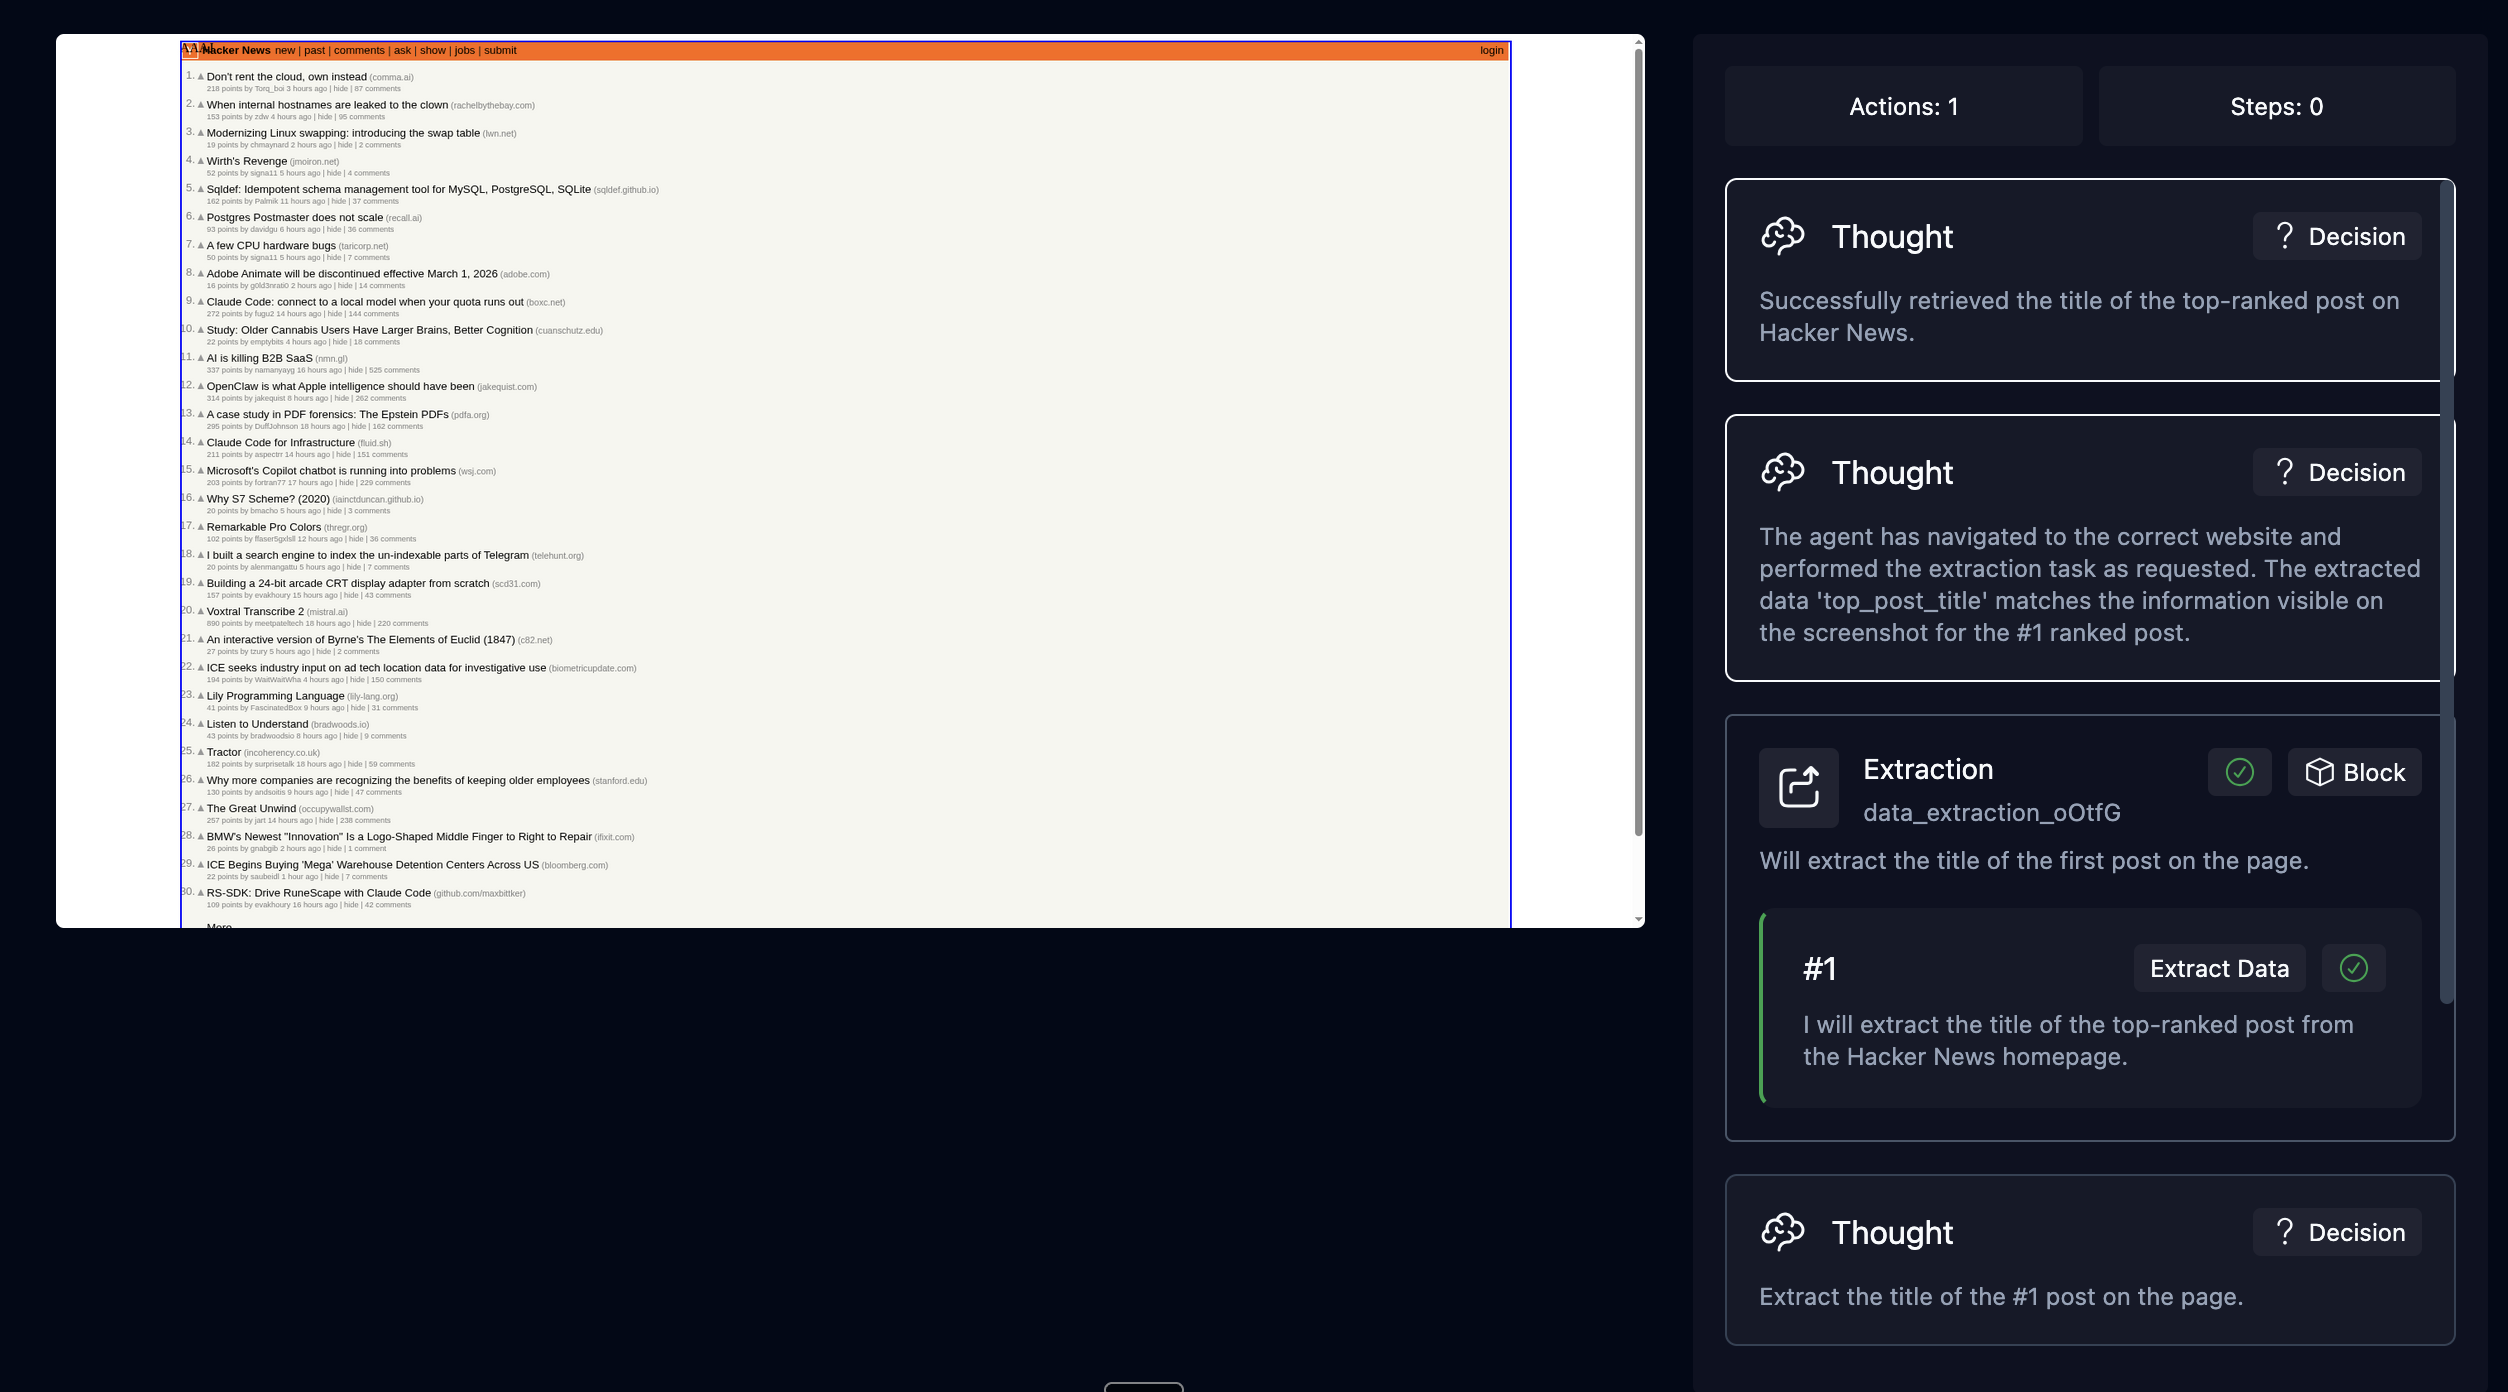
| Card | What it shows |
|---|---|
| Thought | The AI’s internal reasoning — what it sees, what it plans to do, and why. Tagged with “Decision.” |
| Block | When a workflow block starts or finishes (e.g., “Extraction”). Green checkmark = success. |
| Action | Individual browser operations (e.g., “#1 Extract Data”) with a description of what was done. |
Output
All output data in one place. Workflow Run Outputs shows the complete JSON with line numbers and syntax highlighting. Workflow Run Downloaded Files lists any files the workflow downloaded — click to download directly.Parameters
The configuration that produced this run: workflow input parameters (key-value pairs), webhook URL, proxy location, and HTTP headers. Use this to verify a run received the right inputs or to recreate a past result. When you select a block in the Overview timeline, this tab also shows that block’s configuration — prompt, URL, schema, and other settings.Recording
Full video replay of the browser session. Every run is recorded automatically. Scrub through to see exactly what appeared on screen at any point.If the run was canceled before the browser started, you’ll see a “No recording available” message.
Code
Python code generated from the run. This tab appears when code generation is enabled (the default engine). Copy the code to run outside Skyvern, or click Copy & Explain for an AI-generated explanation.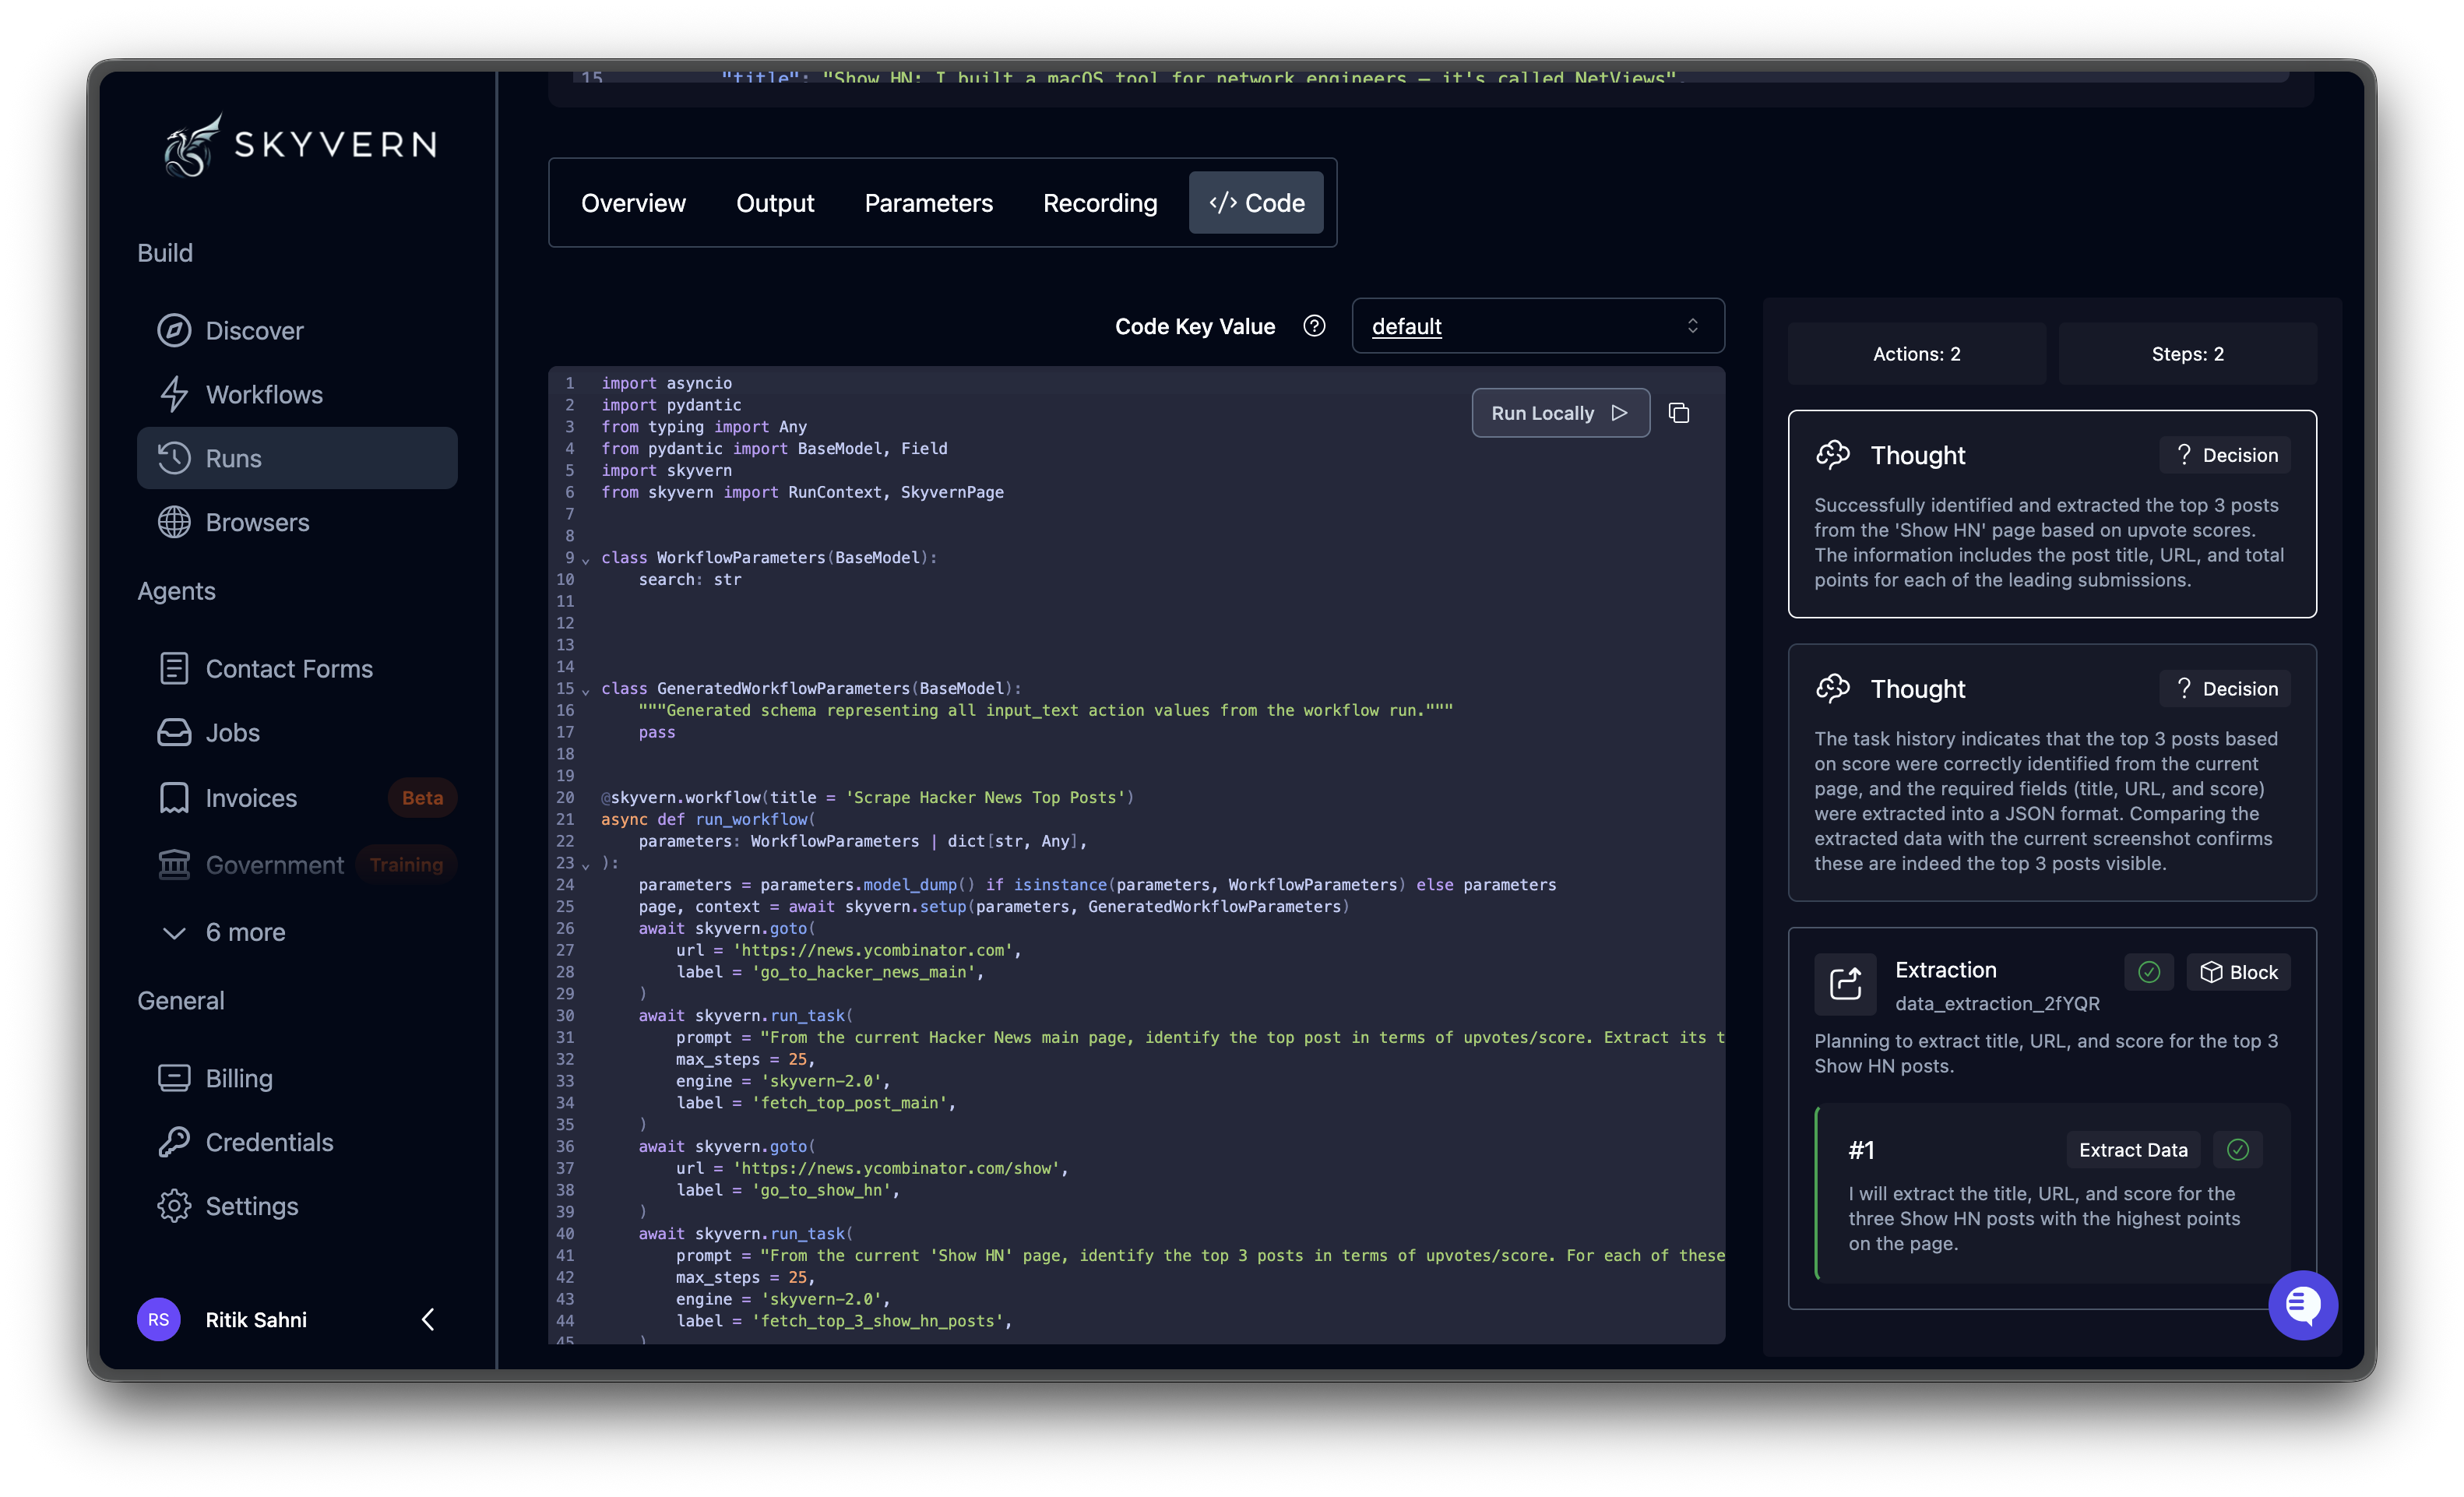
Debugging failed runs
Work through these in order:- Read the Failure Reason at the top. It usually tells you what happened — timeout, navigation error, or missing element.
- Walk the Thought cards in the Overview timeline. Find the point where the AI made an incorrect assumption about page state.
- Check the Parameters tab to confirm inputs were correct. A wrong URL or missing parameter is a common cause.
- Watch the Recording to see what actually happened. Popups, CAPTCHAs, and unexpected page layouts are often obvious on video.
Run statuses
| Status | Meaning |
|---|---|
created | Initialized, waiting to be queued |
queued | Waiting for an available browser slot |
running | Actively executing — browser stream is live |
completed | Finished successfully |
failed | Stopped due to an error |
terminated | Stopped by the system (e.g., resource limits) |
canceled | Stopped by you via the Cancel button |
timed_out | Exceeded the configured time limit |
Downloading Artifacts
Access recordings, screenshots, and output files
Watching Live Execution
Monitor and take control of running tasks